Reflecting on OPEC and its production cut deal – In the face of Iranian sanctions, potential EU exemptions and an OPEC supply boost
Since its December 2016 oil production cut deal came into effect, the Organisation of Petroleum Exporting Countries (OPEC) has seen crude oil prices more than double, following the market rebound from the lows of early 2016. Due to the global anticipation of the Cartel’s voluntary supply withdraws – aimed at further sustaining the technical price recovery – prices have steadily continued to trend higher since the 2014 Brent crude oil contract plunged.
Brokered by Algeria, the deal to cut production volumes – following OPEC’s 2014 attempt to break the US Shale-Oil industry by permitting the global supply overhang – nears its official end in the second half of the year (see Table 1). Questions over the future of OPEC production, in light of OECD crude oil stockpiles falling below the Cartel’s targeted five-year averages, now lingers over the market.
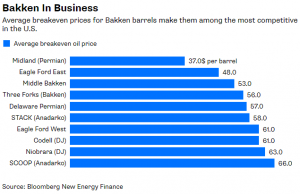
Table 1 – US Shale Producer Break-even cost
This perhaps applies even more to the future price trajectory for the globally traded ‘Black-gold’ going into 2019.
The OPEC strategy now has stockpiles nearing the five-year average oil storage levels of the Organisation for Economic Co-operation and Development (OECD) countries. In late-June, Russia and Saudi-Arabia led the push to increase the production by around 600,000 barrels per day (bpd). The impact of returning crude oil flows from the world’s two largest oil producers (combined total output of over 21 million barrels per day) may still hold influence over Brent crude prices in light of recent supply-side tensions and shocks out of Venezuela, Libya, Angola and Nigeria. However, when looking at the world outside of the OECD, where +80% of oil demand growth and the bulk of non-OPEC supply has come from, further questions have been raised over OPEC’s chosen metric for success with regards to long-term sustainability or effects i.e. not undoing the result of its 2016 ‘Algiers Accord’.
Already, OPEC members’ adherence to the group’s late 2016 total production cut quota of 1.2 million bpd continues to come in higher than the standard 100% expected compliance levels. The overall figure for compliance came in at 162% for May, up from the recent April highs of 149%, due to the unexpected supply disruptions out of Venezuela, Iran, Libya and Nigeria (see Table 2). Furthermore, 7 out of 12 member states saw their supply flows fall more than the designated set levels by OPEC, bolstering the compliance rate above the set 1.2mbpd target to over 1.9mbpd.
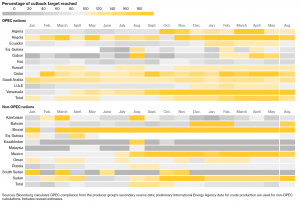
Table 2 – OPEC Production-Cut deal Compliance levels
Additionally, the current Venezuelan sanctions against the incumbent communist government of President Maduro prohibits buying or accepting as collateral any debt owed to the government or state owned PdVSA. This not only adversely impacts one of OPEC’s largest member’s upstream activities, further weighing output levels lower by 600,000 bpd, but also lead to the retraction of production volumes half amounting to almost half of OPEC’s agreed total reduction of 1.2 mbpd.
The newly proposed increase to production levels may simply help mitigate those recently displaced supplies. Alternatively, it could bring OPEC closer to the standard 100% compliance levels come 2019, should opposing member states opt out of the crude booster plan.
The Cartel’s historic approach to assessing market condition through the OECD may also to leave them open to further exogenous shocks from emerging markets (rising Chinese & Indian demand) and non-OPEC/unconventional outputs, such as US shale oil. These have been the key drivers behind supply/demand dynamics since the global economic recovery commenced a decade ago.
Further to this, Saudi Arabia’s Oil Minister, Khalid Al-Falih, raised the need to explore alternative metrics to measure the impact and effectiveness of the 2016 production cut deal ahead of the late June meeting. A meeting with the primary goal to discuss OPEC’s ‘Exit Strategy’ after two steady years of crude oil price increases from the depths of $27 (from January 2016) to an average of over $70 through 2018 thus far.
Outside of OPEC’s sphere of manageable influence, the US shale oil industry remains the greatest threat to global supply/demand imbalances since its surge of over 5.6 mpb in production – or over 140% from the 2008 production levels of 3.97 mbpd, capturing a large market share and diminishing OPEC’s ability to bully the market to its will (see Table 3). On that same note, US oil stockpiles – whilst lingering near their five-year average from 2013 to 2018 – remain approximately 29% above their 2008-2013 five-year averages. These historically high stockpiles drive home the potential risk of sustained high oil exports from the world’s largest economy, even with the shale oil industry facing a lower growth rate while still accounting for around 80% of total global output growth in 2018.
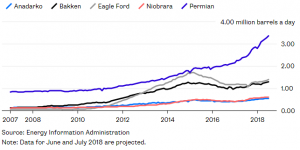
Table 3 – US Shale Production growth rate
Looking ahead:
Delusional or simply misguided by old ways, OPEC’s target of the OECD’s five-year average oil stock levels, which may have been reached, remains largely ignorant of the key issues surrounding the world’s oil cartel and the factors behind its lost market share.
Even the OECD five-year average storage level target comes with its own elements of complications and concerns. The concerns mainly revolve around the fact that it’s a backward-looking indicator (two-month delay for data update) with transparency issues regarding the level of accuracy in assessing, measuring oil volume stored at sea and cargoes currently in transit.
Further to OPEC being blindsided by the rise of shale oil, the global ‘Easy-Money’ environment perpetuated by central banks – namely the US Fed’s Quantitative Easing (QE) program – has also played a key role in the shale supply-boom. This surge has been brought about by the increased use of unconventional production methods such as fracking in the US. The economic environment of low interest rates and easy access to financing have kept frackers operational and have been described as “the secret fuel for the shale revolution” by Raoul LeBlanc (vice president of financial services and North American onshore at IHS Markit). He also noted “the U.S. capital market and the ability to get lots of money very quickly” were going to be key indicators of future shale oil activities outside the market mechanism known as ‘oil prices’.
Overall, crude oil prices may show weakness through the second half of 2018, with the prospect of OPEC production growth mostly influencing market psyche into a ‘Bearish’ mode. This should reduce recent supply restrictions in the face of growing global consumption levels.
Downside oil price actions may further be influenced by growing US production and the world’s economic picture turning sour over the ‘Make America Great Again US Vs. EU, China and the rest of the World’ looming trade war. On the upside, crude oil prices also have the expected 1.44 mbpd increase in demand (up to 98.16 mbpd in 2018) for a Bullish case. This, alongside forecasted global economic growth of 3.8% (Year-on-Year), should see markets, at worse, move sideways around the current 2014 highs or slightly lower. However, crude oil prices should still remain north of the $60 mark going into the year-ahead, especially considering global storage levels have only come down toward five-year averages based on some of the highest inventory levels recorded in decades of trades.
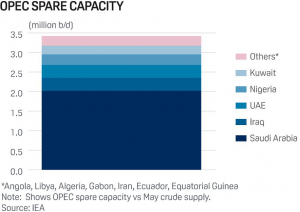
Table 4 – OPEC available production capacity
In other words, the current U.S. five-year oil stock averages stand at almost 30% above the five-year averages prior to 2013. And despite the push for wider production growth of 1 million barrels per day (bpd), actual output increases of around 600,000bpd are being forecast due to the fact other OPEC member states cannot grow their supplies (see Table 4).
Serge is an Oil Price contributor. His profile and articles can be viewed here.
Monarch November 2017: OPEC poised to extend oil cut to end of 2018
Visit also our Intelligent Procurement section.


