Year-on-year variation in winter energy demand
As we draw closer to the end of winter and begin preparing for spring, it’s time to look back on our energy use over the colder months. It’s no secret that we use more energy throughout winter to keep our homes warmer and to light up the longer, darker hours of the day. But how does this usage compare to other sunnier times of the year? Further to this, how does our usage over the 2018-2019 winter compare to previous winter of 2017-2018? In a time when the effects of climate change are becoming more and more apparent, it’s important to consider the impact they have on our energy supplies.
Energy markets across the world are volatile and are often determined by weather conditions – something that global warming plays a role in. In March 2018, the National Grid had to issue a gas deficit warning following the “Beast from the East” which plunged the UK into a cold spell lasting for several weeks. The warning meant that more gas came onto the market and allowed Britain to draw fuel from a number of sources, securing the supply. The conditions experienced in winter 2017-2018 were much colder than recent years, requiring new strategies across the gas network in order to balance it effectively.
In early 2018, Reuters made predictions for the UK’s energy demand for the upcoming winter – which we’re just coming out of now. They expected electricity demand to peak in early December 2018, and for wholesale electricity prices to be volatile due to particularly unpredictable weather conditions. This had a knock-on effect for weather-dependent sources of renewable energy such as solar and wind power, with the uncertainty driving up prices for customers.
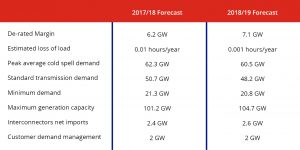
Electricity breakdown:
Gas breakdown:
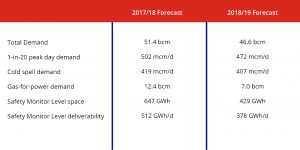
Before each winter, the National Grid releases a winter outlook report which predicts energy supply throughout the UK for the upcoming colder months. They base these predictions on activity in previous years and weather forecasts. Above are two tables with information from National Grid outlook reports which detail predicted breakdowns for gas and electricity demand in the UK. On the electricity forecast demand table, it’s clear to see that the average cold spell demand is lower for this winter than last winter. We can also see that the UK is due to import more electricity now than last winter, and that the minimum demand is lower. This is all positive for billpayers, as with lower demand comes lower prices.
The breakdown of predicted gas demand for winter 2018-2019 also paints a positive picture for customers and their wallets. The total demand is almost 10% lower than that of winter 2017-2018, and the gas-for-power demand has dropped significantly from 12.4 bcm (billion cubic metres) to 7.0 bcm. In fact, every area of the forecast for this winter predicts lower gas demand and therefore lower prices for consumers. That’s without taking into account a 2019 Beast from the East, or any other extraordinary weather conditions, but with spring rolling into view, we look to be in the clear on that front.
Seasonal variation in the UK’s electricity demand
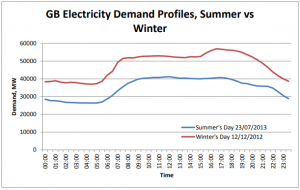
Moving away from year-on-year differences in energy demand, more pronounced variations come when comparing individual seasons within the same year. The government’s Department of Energy & Climate Change (DECC) produced a report in March 2014 comparing electricity demand for a week in December 2012 and a week in July 2013. Again, the DECC (now named the Department for BEIS – Business, Energy & Industrial Strategy) noted that electricity demand fluctuates based on a number of factors, particularly weather conditions. The report gives the difference in electricity demand between the average winter’s day and summer’s day as 36% – with the winter’s day obviously being the higher of the two.
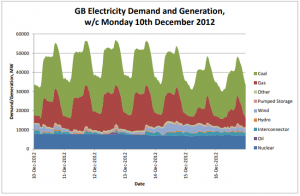
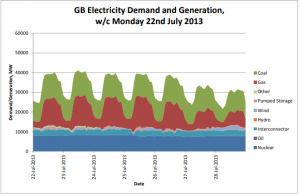
This is because people need to heat their homes in the colder weather and rely on more indoor lighting as it becomes darker outside for larger portions of the day. The first graph below shows a surge for both summer and winter electricity demand in the mornings as people get up and begin turning on lights and appliances throughout the home. In winter, however, there is a second daily surge when people arrive home from work and put on the heating and lights in their homes. This is particularly evident when comparing the second and third charts below – the winter chart shows a maximum electricity demand of approximately 55,000 MW, while this figure is only 40,000 MW in the summer chart.
Future gas and electricity demand
Although we’re now leaving winter behind – which, in theory, should bring more stability – Brexit looms in our very near future. Without, at the time of writing, any kind of deal on the cards, the fate of the UK’s interconnectors, and therefore energy supply from any other countries, is uncertain. Two things which we do know for sure are that energy demand will always be higher in winter than summer, and that the more volatile the weather is, the higher energy demand will be. Beyond that, in this tumultuous pre-Brexit time, we don’t know much else.
Read more…
Brexit update: How will the UK’s departure affect the energy markets?
